
ClockMaster app analyzes the ticking of a pendulum clock to determine the running rate of the clock in Beats Per Hour (B/H). This rate is compared to a specified Target Rate, and the Error is calculated in Seconds Per Day fast or slow (±S/D).
The app records the acoustic sound of the escapement so it is extremely important that measurements take place in very quiet environment.
Always use the Set Up tab before initiating a measurement. This assists you in determining the optimum position, microphone and settings for the particular clock being tested. You are provided with an estimate of the clock running rate and can also level the clock in beat.
This is a crucial step for accurate results. Your goal is to ensure clean and accurate tick sound pickup, with as little noise as possible, so the app can reach and remain in READY (Locked) state for at least a minute.
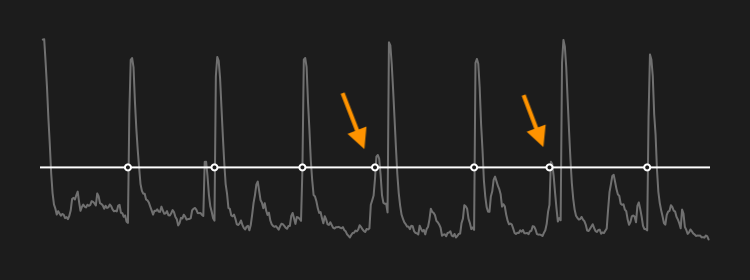
The captured audio waveform is plotted in real-time. As you adjust the device position and various settings, be sure to observe the plot and determine what works best. The Pause button can be used to freeze the display and also to reset the Lock status.
The internal and headset microphones function best in a quiet environment. Ambient noise may affect the accuracy of the measurement and cause incorrect results. For best results, we recommend the use of an external piezo-acoustic contact microphone. Learn More
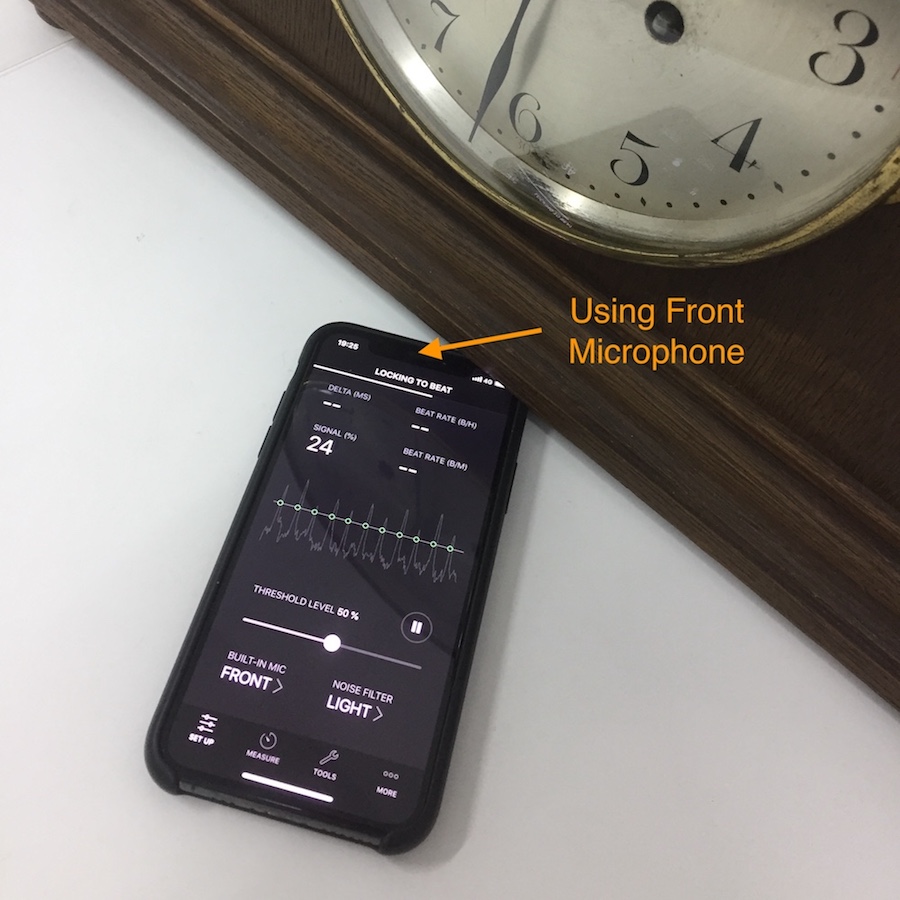
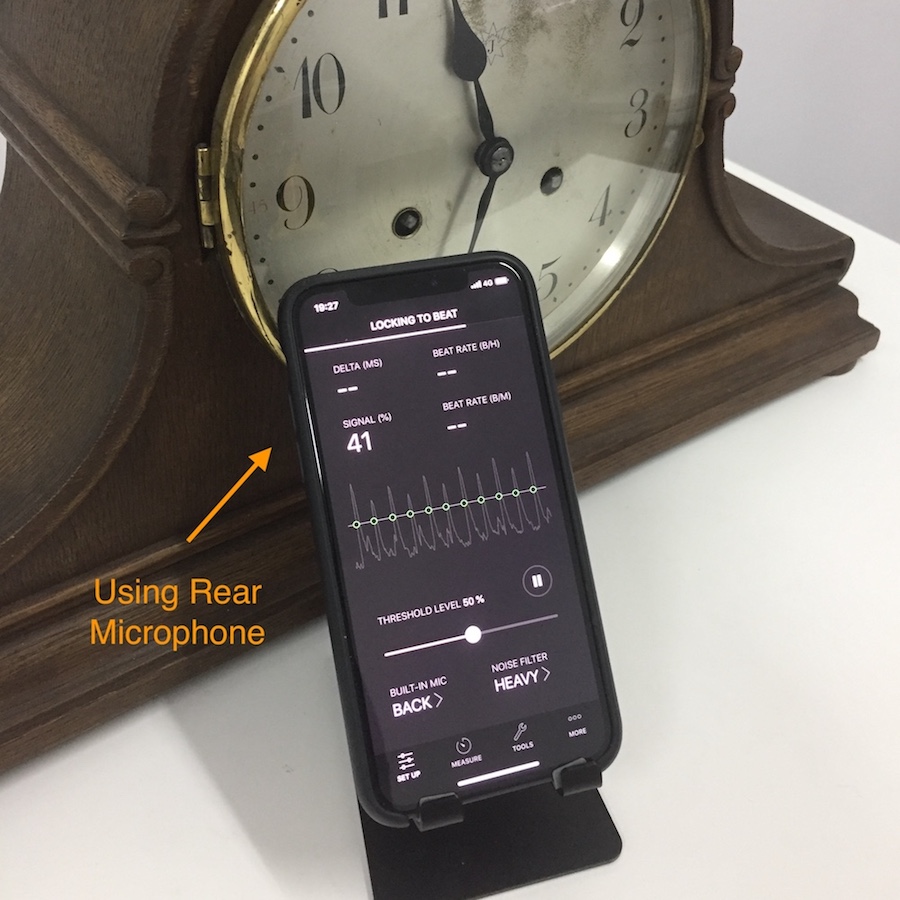
When using the internal mic, place the iPhone as close as possible to the clock movement or where it is the loudest. This will vary with each type of clock. The closer the positioning the more accurate the hearing of the ticking sound. You can select any of the iPhone's built-in microphones: Front, Rear or Bottom. A particular mic will work better depending on placement, clock type and design.
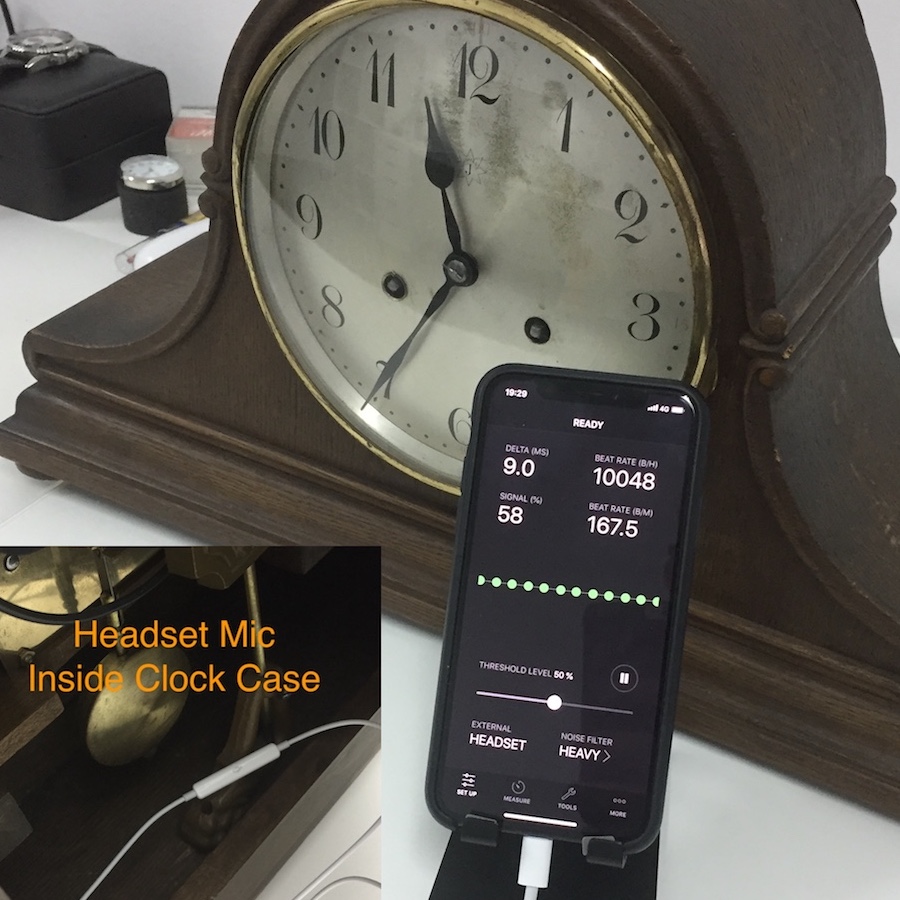
The external EarPods' microphone performs much better: You can place the mic inside the clock case, closer to the movement, while having more freedom to operate the app. This also provides better isolation of the clock ticking from ambient noise.
(Click To Zoom)
For more ideas on microphone use, please watch this video.
Start with "Heavy" filtering, and switch to "Medium" or "Light" if needed.
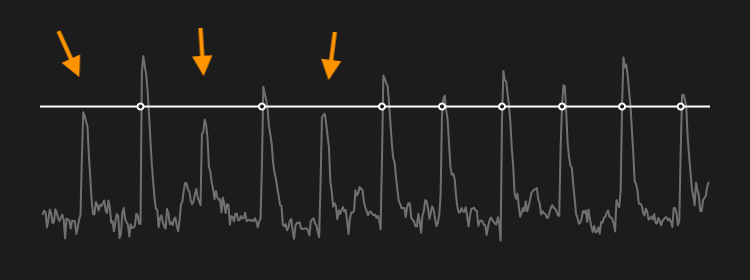
The threshold level is adaptive and relative to the current noise levels. A setting of approximately 50% will typically work best. You may need to adjust the level for clocks with irregular tick and tock loudness, or to avoid parasitic noises on some movements. Ensure no ticks are missed (fig.1) and no extra noises are picked up (fig.2).
To better understand the threshold level setting, please watch this video.
When the app clearly "hears" a beat, it will display the Signal Strength percentage and continue to further "lock" to the beat. Shortly after, estimates for clock running rate in both Beats Per Hour (B/H) and Beats Per Minute (B/M) will be shown. The difference between Ticks and Tocks, called Delta will be shown in Milliseconds (MS) and continuously updated.
The Delta readout can assist you in leveling the clock in beat. On a mantel clock raise one side or the other by small amounts. For wall clock, slightly move the bottom of the case left or right. Listen for evenness in the ticks. Carefully track the Delta values and aim for as close to zero as possible. The readout may slightly vary over time depending on the clock quality and wear.
For smaller clocks with fast beat rates a Delta below 10ms is sufficient. For long case grandfather clocks, a value of up to 20-30ms is acceptable.
Once you have discovered the best position and microphone settings, and have a clean and stable signal being recorded, a measurement can be executed.
As build quality, wear and other factors could cause large fluctuations in clock speed, the rate is calculated as a running average. The longer the measurement, the more precise the averaged rate. At least 30 minutes or more should be conducted for a rate of any value. A couple of hours will reveal patterns specific to the clock under test.
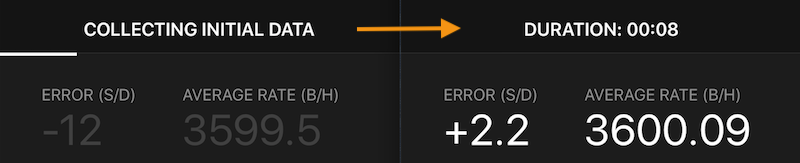
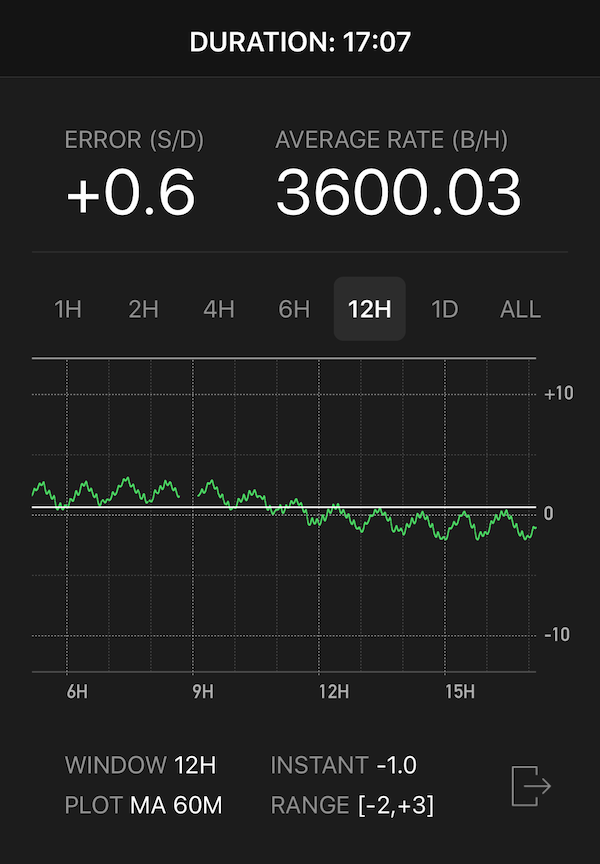
The error is presented in Seconds Per Day (S/D) and the rate in Beats Per Hour (B/H). These values will fluctuate in the beginning, and become more stable and precise over time as more data is aggregated. During the initial data collection (5-6 minutes), the values are grayed out.
Once again, this is a running average and represents the whole duration.
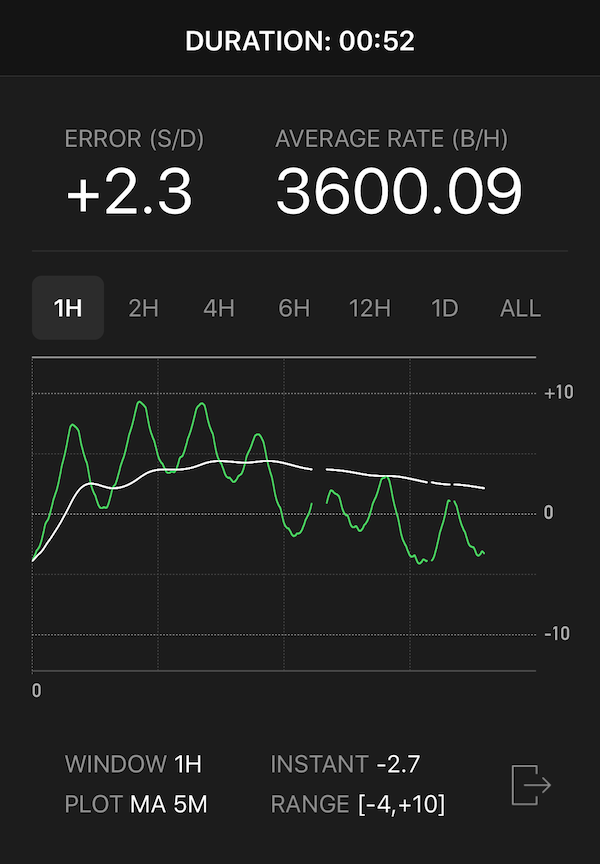
To better illustrate fluctuations in rate, a continuous trace is plotted. This helps you find, observe and understand patterns developing over time. The measured running average rate is shown in white, while an "instantaneous" rate, calculated as a moving average of preceding N minutes, is shown in green.
Use the buttons located at the top to select the visible display window. For measurements longer than the display window, the most recent part is shown. Select "ALL" to have the whole measurement fit on screen, no matter hours or days.
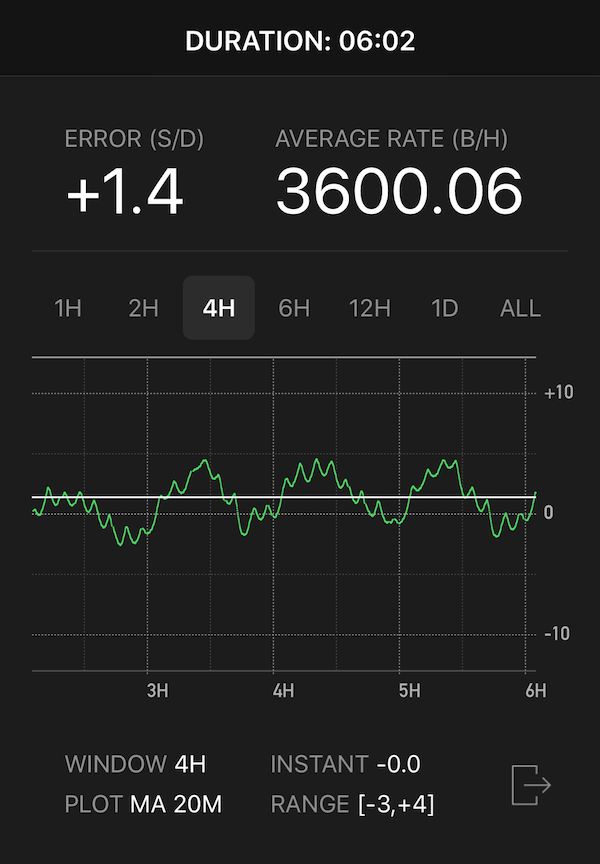
The moving average is adaptive and depends on the display window selected. For 1 hour window, the plot is averaged over 5 minutes, for 2 hours it is 10 minutes and so on, up to 60-minute moving average for longer duration.
Underneath the chart, the latest error sample is shown along with the range during the selected display window [slowest,fastest]. These values reflect the current moving average and will vary for different display windows.
Each chart has its own information to give. (Click To Zoom)
To calculate the Error in Seconds Per Day, the correct Target Rate for the clock movement under test is required. [ See: Clock Target Rate ]
If a target rate is not set (the CLEAR button), the app will only display clock's running rate. This mode may be useful for observing stability and rate change over time even if the exact error is not known.